Use Conversion insights to understand and measure the impact that Bazaarvoice UGC has on your e-commerce performance. These insights show you:
- the benefits of having content displayed on your site
- how visitors are engaging with the content and your messages
- how engagement helps convert browsing visitors to customers

Conversion insights has two tabs:
- Displays- Find out how Bazaarvoice UGC on your site inspires visitors to complete goals, convert browsers to customers, and place orders of higher values.
- Messages - Find out how recipients are engaging with your communications through Bazaarvoice.
Go to Conversion insights
- Sign in to the Bazaarvoice Portal
 .
. - From the navigation bar, select Insights.
- From the left-hand navigation bar, select Conversion.
Before you begin
To access the Displays tab, you must:
- Configure pages on your site to display Bazaarvoice UGC.
- Add the BV Pixel loader file to the pages on which you want to track visitor transactions.
- For transactional metrics, add the Transaction event tag to your BV Pixel implementation. You can also send transaction data from your Google or Adobe analytics integrations.
- For behavioral metrics, add the Conversion event tag to your BV Pixel implementation.
To access the Messages tab, you must have sent messages through Bazaarvoice in the selected period. If there is no data, adjust your filters or configure messages to begin sending messages through Bazaarvoice.

Data availability for Conversion insights
Data availability for the most recently completed month depends on your BV Pixel implementation and the types of data it's configured to send.
- If your dashboard measures transactional data, like conversion rate, average order value, and revenue per visitor, you can select the most recently completed month on the sixth day of the current month. This data availability depends on a three-day attribution window that begins on the first day of the current month, followed by three additional days of data processing.
- If your dashboard measures behavioral data, like goal completion, you can select the most recently completed month on the third day of the current month. This data availability depends on three days of data processing.
Data availability example
The following calendar illustrates the period of time captured in a month:
| 1 | 2 | 3 | 4 | 5 | 6 | 7 |
| 8 | 9 | 10 | 11 | 12 | 13 | 14 |
| 15 | 16 | 17 | 18 | 19 | 20 | 21 |
| 22 | 23 | 24 | 25 | 26 | 27 | 28 |
| 29 | 30 | 31 | 1 | 2 | 3 | 4 |
| 5 | 6 |
Key: Engagement and transactions | Transactions only | Data processing | Data available
For May's data, the following dates apply:
Transactional data
- June 1-3: Attribution window
- June 4-5: Data processing
- June 6: May selectable in date filter
Behavioral data
- June 1-3: Data processing
- June 3: May selectable in date filter
Attribution window
When a visitor completes an order, that order and its revenue is attributed to the shopper's most engaged session within three days of their initial visit to the product page. These three days are known as the attribution window.
For example, a customer might look at reviews on a product display one day, but purchase the product the next day. This purchase falls within the window of time when Bazaarvoice attributes the purchase to the reviews that the customer read.
Displays tab
Displays dashboards show how Bazaarvoice content displayed on your site inspires visitors to complete goals, convert, and place orders of higher value. Use this dashboard to evaluate how displaying UGC affects your site experience by measuring visitor engagement, goal completion, conversion rate, average order value, and revenue per visitor across different levels of engagement.
Depending on your implementation, there are two views with different dashboards for each. Choose between the following two options on the upper-right corner of the tab:
- Transactional - Provides insights into visitor engagement that results in purchases or encourages higher value purchases. Dashboards include:
- Visitors
- Conversion
- RPV
- AOV
- Behavioral - Provides insights into visitor engagement and how Bazaarvoice content encourages goal completion. Dashboards include:
- Visitor engagement
- Goal completion
For both views, engagement is tracked in two parts, and displayed as a combined amount. You can hover over the engaged metrics to view the breakdown:
- Actively engaged - Visitors interacted with UGC on your site, for example, clicked through review photos.
- Passively engaged - Visitors browsed or scanned UGC on your site, for example, read a review but didn’t click through multiple reviews or didn’t play the video attached to a review.
It’s important to note that engagement that is tracked for Review Summaries depends on if you enabled the Show more button in your implementation. This is because:
- If you enabled the Show more button:
- Engagement is passive if a user only reads the preview.
- Engagement is active if a user clicks Show more.
- If you did not enable the Show more button:
- Engagement is always tracked as passive because there are no elements on the page for a user to interact with.
Displays filters
| Filter type |
Filters | Description | View |
|---|---|---|---|
| Date |
This month |
Automatically defaults to the most recent month available. |
Behavioral |
| Last month | Automatically defaults to the most recent month available. | Transactional | |
| Last quarter |
Automatically defaults to the previous three months based on when the data was last available.
|
Behavioral |
|
| Last 3 months | Automatically defaults to the previous three months based on when the data was last available. | Transactional | |
| Last 6 months | Automatically defaults to the previous six months based on when the data was last available. | Transactional | |
| Last quarter | Automatically defaults to the previous quarter based on when the data was last available. | Both | |
| Last 12 months |
Automatically defaults to the previous 12 months based on when the data was last available.
|
Both |
|
| Last year |
Automatically defaults to the first and last month of the previous year, based on when the data was last available.
|
Both |
|
| Custom |
Allows you to manually enter a specific date range up to 2 years from when the data was last available. |
Both |
|
| Content |
Display type |
Include data from the selected Bazaarvoice content display type. |
Both |
| Deployment zone |
Include data from the selected deployment zone. A deployment zone is a page to which you deploy an implementation. Learn about configuring and deploying implementations to staging and production environments. |
Both |
|
| Goals |
Include data from visitors to pages that contain interactive elements that map to the selected visitor goal. For example, selecting the goal Add to Cart will include data only from pages that contain an Add to Cart button. |
Behavioral |
|
| Products |
Category |
Include data from the selected product category. You can only select a category within the first level of your category hierarchy, as defined in your product catalog. |
Both |
Dashboards on the Transactional view
At the top of the Transactional (default) view, there are four metric cards that dynamically update based on the filters selected:
- Visitors— overall percentage of visitors who engaged actively or passively with Bazaarvoice content on your site.
- Conversion— overall percentage of engaged visitors who completed a purchase.
- RPV — overall average revenue per visitor generated by engaged visitors.
- AOV — overall average order value generated by engaged visitors.
Each card also displays the median industry benchmark and the % increase or decrease in the metric when compared to the previous time period.

Export Conversion insights
To export your Conversion insights on the Transactional(default) view, you can:
- Export to PDF - Select the action menu in the upper-right corner, then select Export PDF. This provides a PDF version of all your Conversion dashboards.
- Export to CSV - Select the action menu in the upper-right corner of the Engagement by display type table, then select:
- Download Engagement CSV - This provides all Conversion metrics broken down by engagement level.
- Download Display Type CSV - This provides all Conversion metrics broken down by display type.
| Visitors |
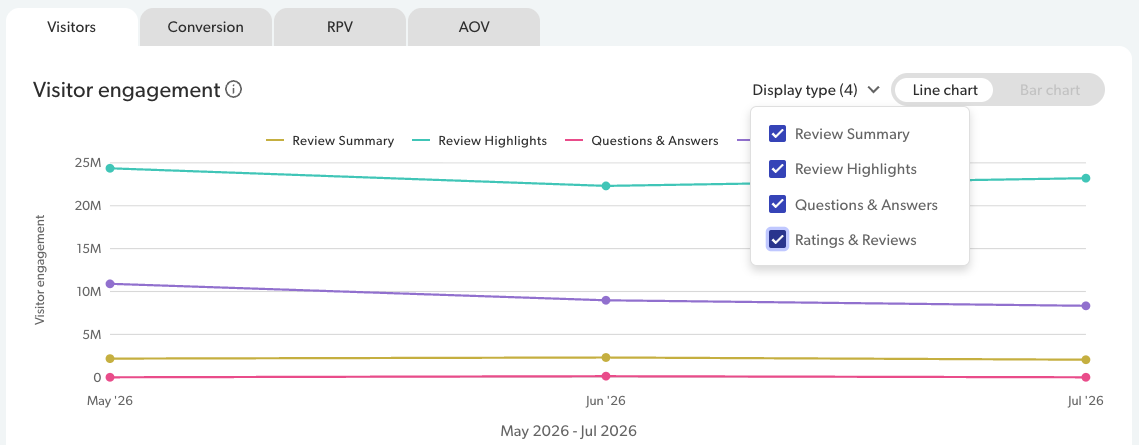
Understand how many unique visitors visited a page where a Bazaarvoice display is installed and how much they engaged with the displayed UGC. Visitor metrics are tracked by the BV loader. Visitor engagementThe Visitor engagement line chart displays the percentage of visitors for each display type or all display types. The default view for this chart displays an aggregate of data for all display types over the past three months. Hover over each line to view the breakdown by engagement level or use the Display type dropdown to view data for specific display types. The following image shows an example of the line chart with each display type selected and no comparison date range selected.
Note: For date comparisons where the current period and previous period are not for the same length of time, this line chart is not available.
The bar chart displays the number of visitors for each engagement level. The default view for this chart is an aggregate of data for all display types over the past three months. The following image shows an example of the bar chart with the comparison date range selected.
Below these charts, you can select Show data table to view the visitor engagement data in a table format. This table also includes the percentage breakdown of active and passive engagement out of the total engagement percentage. Engagement by display typeThis table displays the breakdown of engagement for each display type and includes the following data:
|
||||||||||||||
| Conversion |
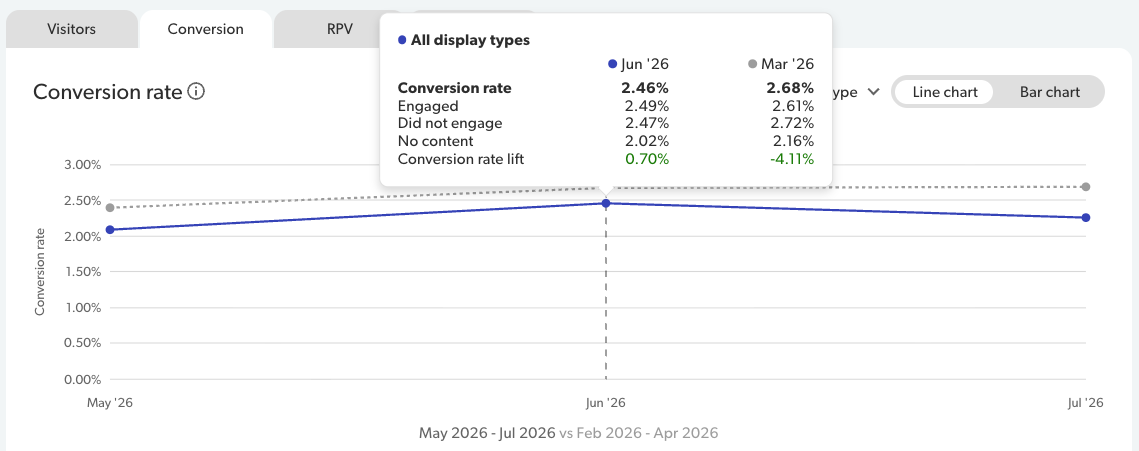
Understand how many visitors placed an order on your site and the difference in conversion between visitors who did engage and visitors who did not. Visitor metrics are tracked by the BV Pixel conversion event. The conversion rate is calculated based on Orders divided by Engaged visitors. Conversion rateThe default view for this chart displays an aggregate of data for all display types over the past three months. The Conversion rate line chart displays the conversion rate for each display type or all display types. Hover over each line to view the breakdown by engagement level or use the Display type dropdown to view data for specific display types. The following image shows an example of the line chart with an aggregated view of all display types and a comparison date range selected.
Note: For date comparisons where the current period and previous period are not for the same length of time, this view is not available.
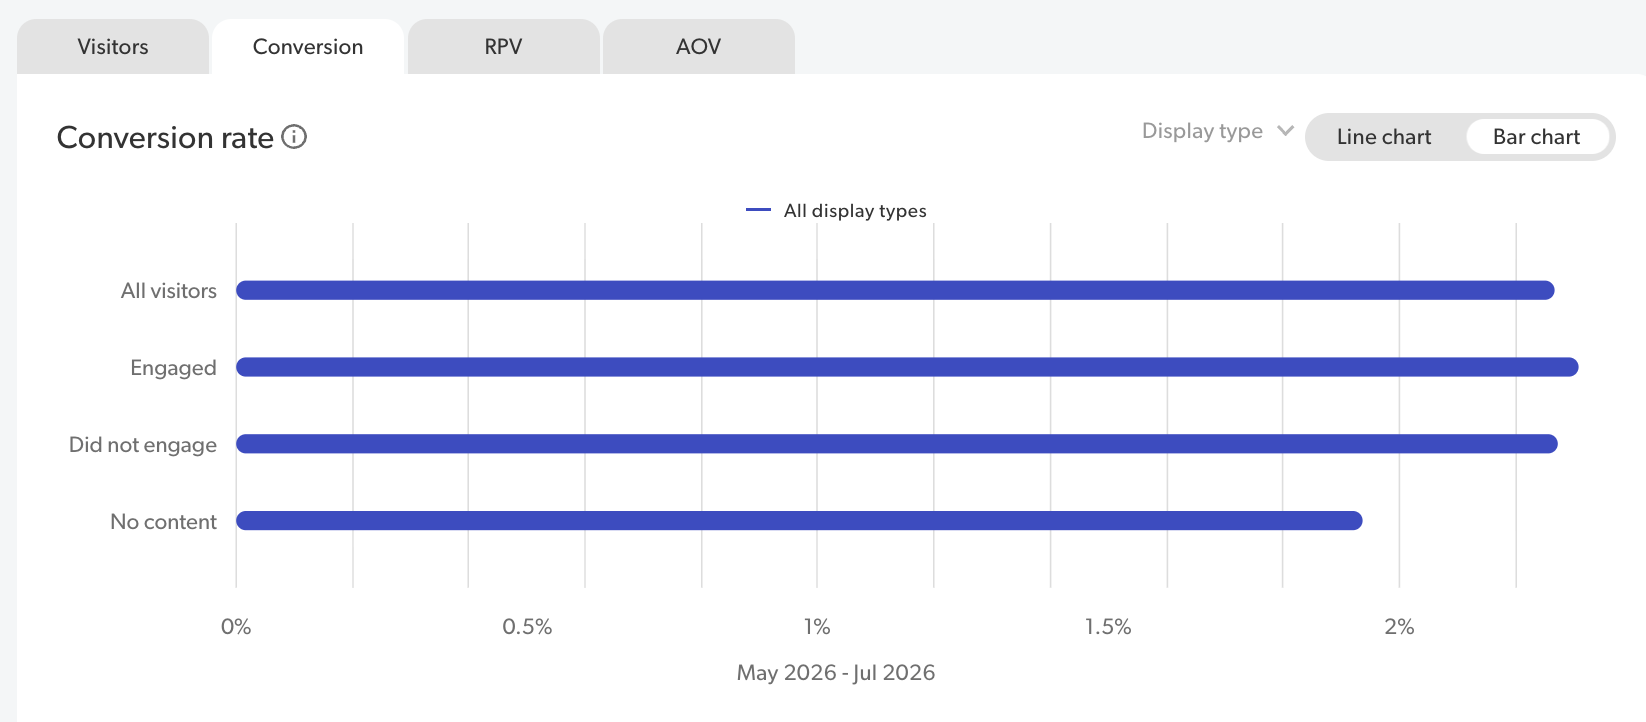
The bar chart displays the conversion rate based on each engagement level. The default view for this chart is an aggregate of data for all display types over the past three months. The following image shows an example of the bar chart with no comparison date range selected.
Below these charts, you can select Show data table to view the conversion data in a table format. This table also includes the percentage breakdown of active and passive engagement out of the total engagement percentage. Conversion rate by display typeThis table displays the breakdown of engagement for each display type and includes the following data:
|
||||||||||||||
| RPV |
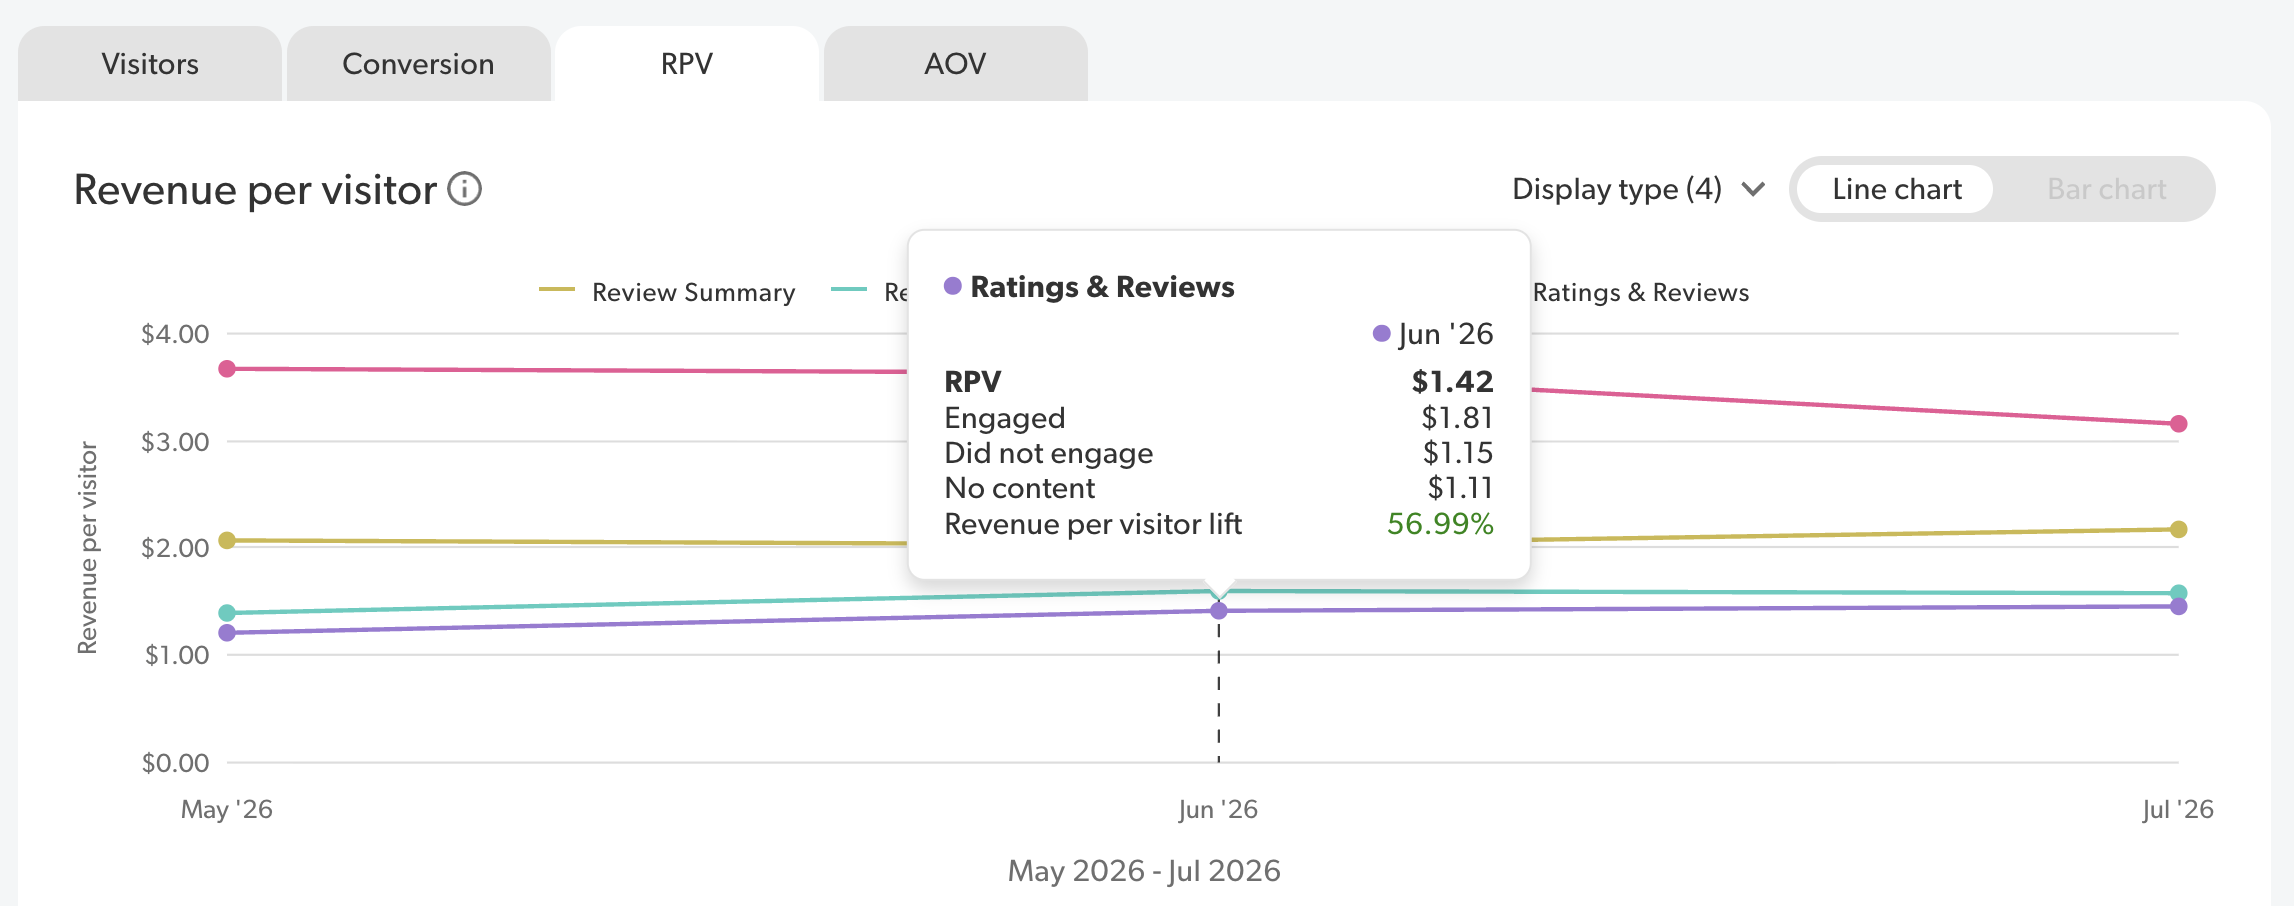
Understand the impact that Bazaarvoice content has on the average revenue generated across all visitors. Visitor metrics are tracked by the BV Pixel transaction event. RPV (Revenue per visitor) is calculated based on Revenue divided by Engaged visitors. Revenue per visitorThe Revenue per visitor line chart displays the average RPV generated for each display type or all display types. Hover over each line to view the breakdown by engagement level or use the Display type dropdown to view data for specific display types. The following image shows an example of the line chart with each display type selected and an example of the hover over tooltip.
Note: For date comparisons where the current period and previous period are not for the same length of time, this view is not available.
The bar chart displays the average revenue per visitor for each engagement level. The default view for this chart is an aggregate of data for all display types over the past three months. The following image shows how the bar chart looks with no comparison period selected and the tooltip for All display types. 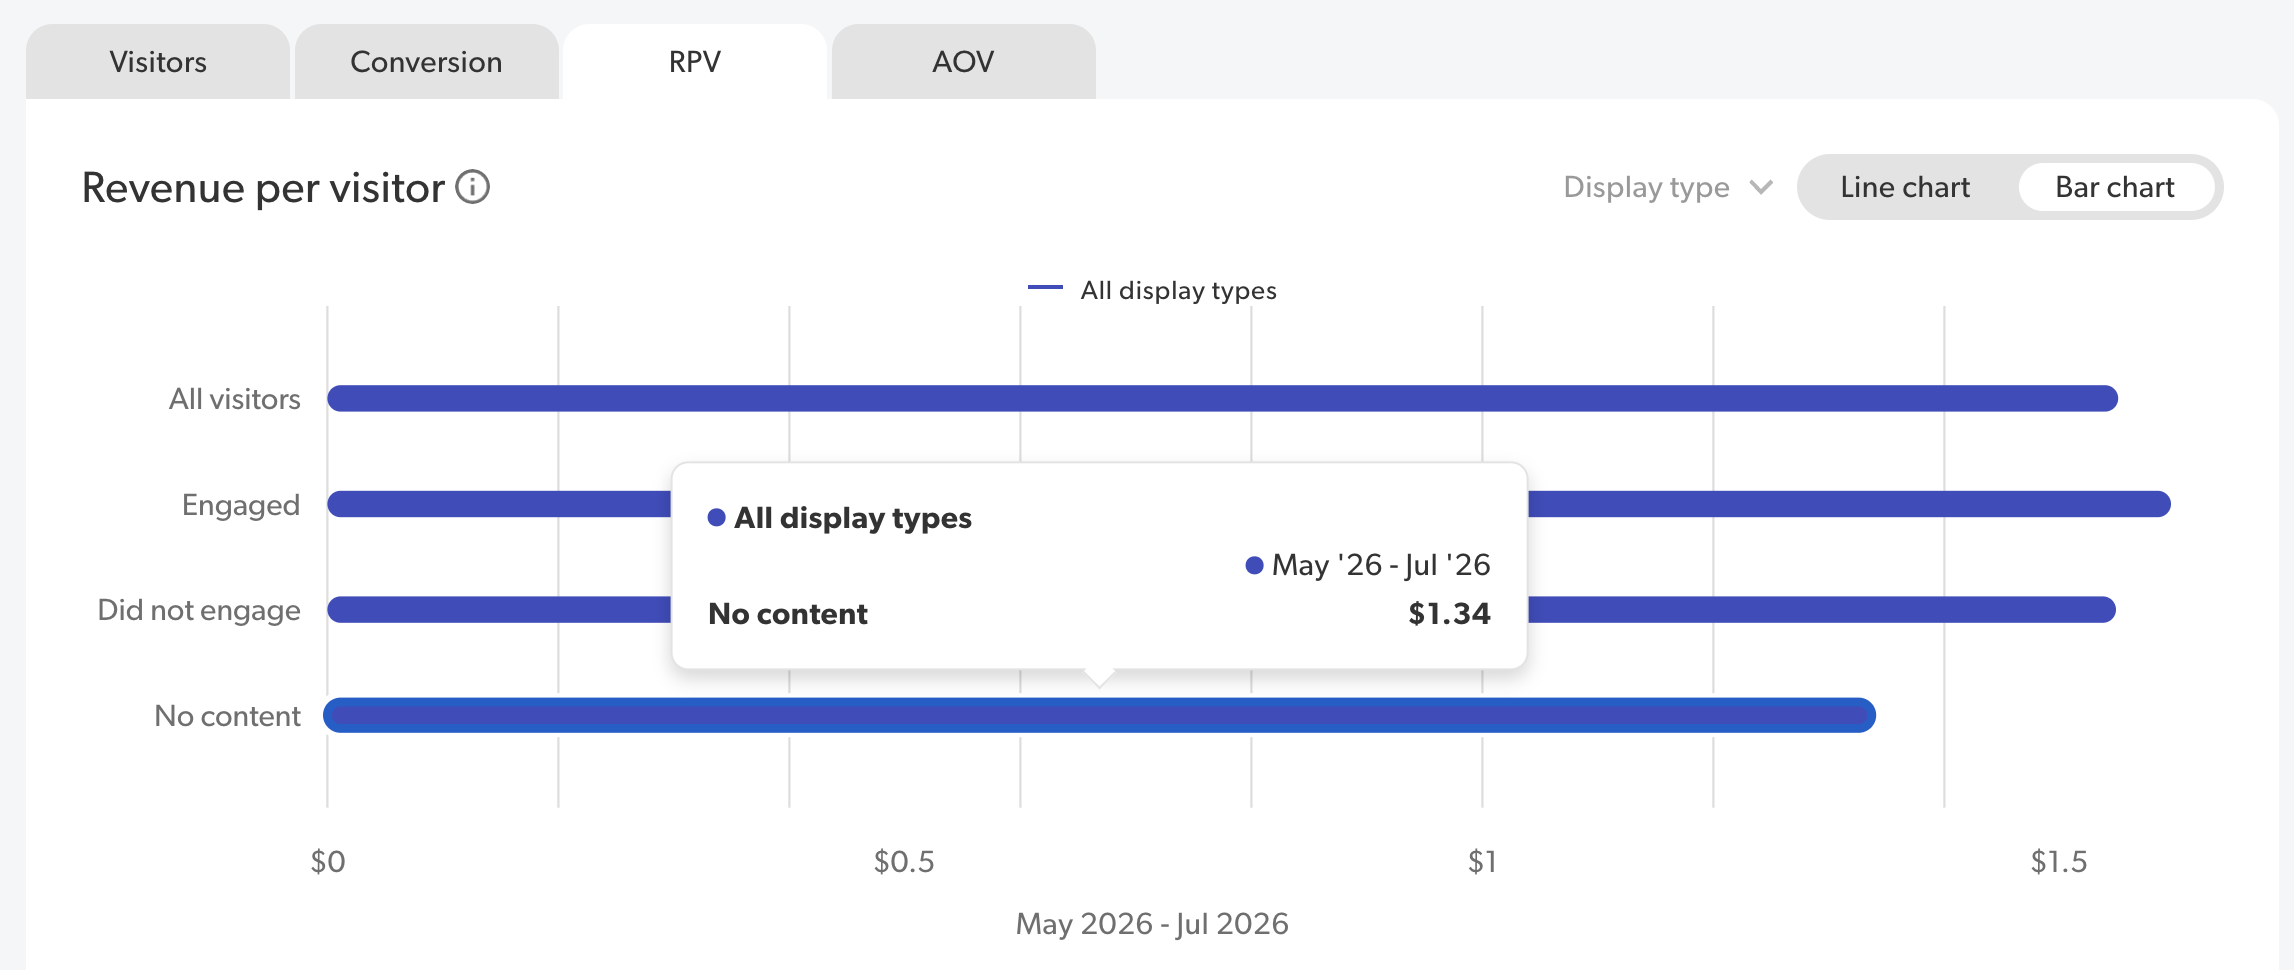
Below these charts, you can select Show data table to view the RPV data in a table format. This table also includes the percentage breakdown of active and passive engagement out of the total engagement percentage.
Revenue per visitor by display typeThis table displays the breakdown of engagement contributed to the RPV for each display type and includes the following data:
|
||||||||||||||
| AOV |
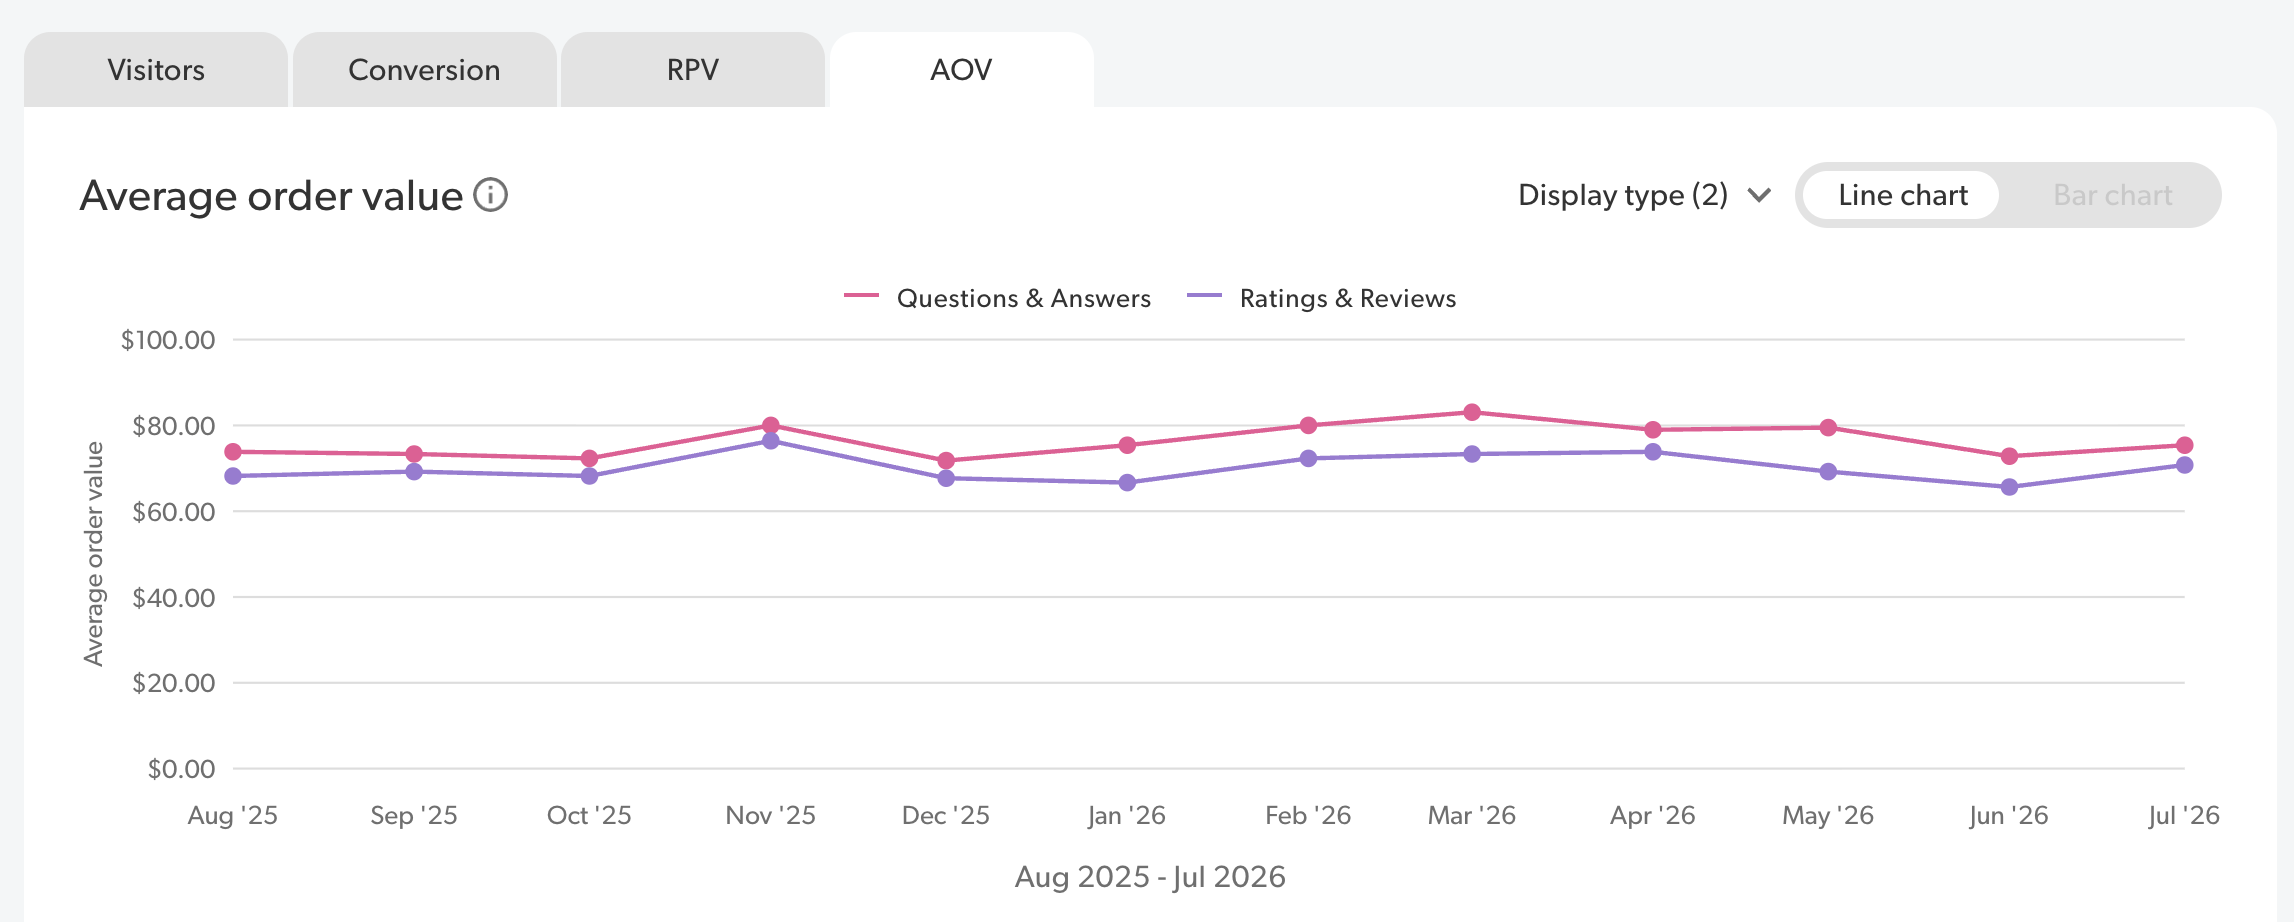
Understand the impact that Bazaarvoice content has on the average amount spent on orders across all visitors. Visitor metrics are tracked by the BV Pixel transaction event. AOV (Average order value) is calculated based on Orders divided by Revenue. Average order valueThe Average order value line chart displays the AOV generated for each display type or all display types. Hover over each line to view the breakdown by engagement level or use the Display type dropdown to view data for specific display types. The following image shows an example of the line chart with two display types selected.
Note: For date comparisons where the current period and previous period are not for the same length of time, this view is not available.
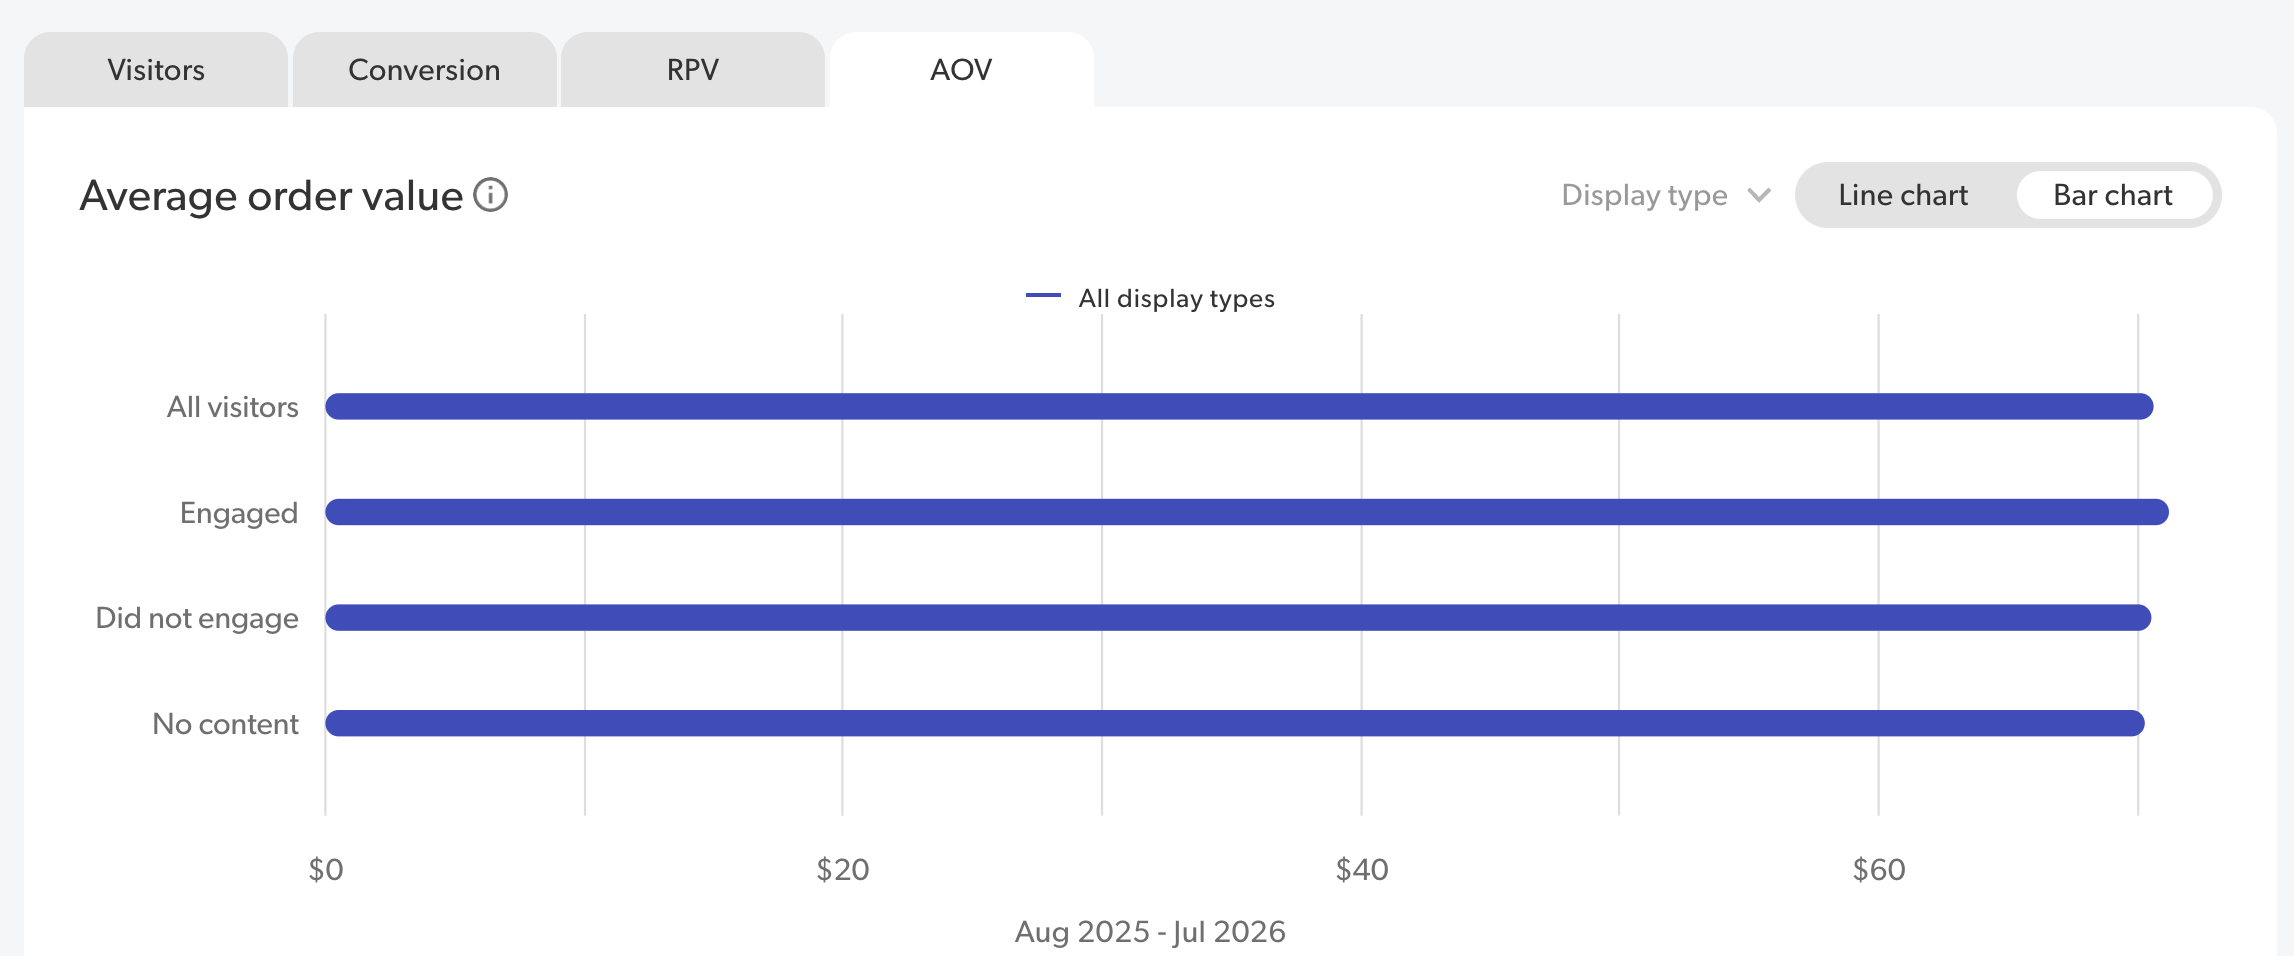
The bar chart displays the average order value for each engagement level. The default view for this chart is an aggregate of data for all display types over the past three months. The following image shows how the bar chart looks with the aggregation of All display types.
Below these charts, you can select Show data table to view the AOV data in a table format. This table also includes the percentage breakdown of active and passive engagement out of the total engagement percentage.
Average order value by display typeThis table displays the breakdown of engagement that contributed to the AOV for each display type and includes the following data:
|

Dashboards on the Behavioral view
| Visitor engagement |
Understand how many unique visitors visited a page where a Bazaarvoice display is installed and how much those visitors engaged with the displayed UGC. Visitor metrics are tracked by the BV loader. The Visitor engagement graph displays a snapshot of the number of visitors for each engagement level based on the date range selected. The insights on the left-hand side of the dashboard include:
You can also select Show data table to view these metrics in a table format or select Export to download the metrics as a CSV. |
||||||||||||||||
| Goal completion |
Understand how the presence of and engagement with Bazaarvoice content affects the rate at which visitors complete behavioral goals. Goals are visitor behaviors on pages with interactive elements like Where To Buy or Add To Cart buttons. Goals are defined and tracked by the BV Pixel conversion event.
Goal completion is calculated as # Goals divided by # Visitors.The Goal completion graph and metrics display a snapshot of engagement for each visitor type:
You can also select Show data table to view these metrics in a table format or select Export to download the metrics as a CSV. |
Messages tab
Use this tab to see how recipients are engaging with your messages sent through Bazaarvoice and view the trends over time.
At the top of the tab, you can use the toggle to change how Insights aggregates the data. You can select Unique or Total to view the number of times that recipients engaged with your messages in the selected period.
Messages filters
Use the following filters to limit the dataset for your Messages dashboards:
|
Filter type |
Filters |
Description |
|---|---|---|
|
Date |
Last 30 days |
Automatically defaults to the last 30 days counting backward from when the data was last available. Comparison filtering is also available. |
|
Last month |
Automatically defaults to the first and last day of the previous month. Comparison filtering is also available. |
|
|
Last quarter |
Automatically defaults to the first and last day of the previous quarter. Comparison filtering is also available. |
|
|
Last year |
Automatically defaults to the first and last day of the previous year. Comparison filtering is also available. |
|
|
Custom |
Allows you to manually enter a specific date range up to 2 years from when the data was last available. Comparison filtering is also available. |
|
|
Content |
Message type |
Select the types of Bazaarvoice messages for which you want to display engagement data. |
|
Method type |
Select a message delivery method to display engagement data for that type. Messages can be delivered by email, SMS, and MMS. |
|
|
Locale |
Select a region and language in which messages were originally sent to display engagement data from that locale. |
|
|
Deployment zone |
Include data from the selected deployment zone. A deployment zone is a page or site to which you deploy an implementation. Learn about configuring and deploying implementations to staging and production environments. |
Dashboards on the Unique view
The Unique view counts the number of distinct messages in which the engagement event was captured for the first time. Each unique event can be captured once for each message sent.
For example, if a message was sent in June but opened in July, and you filtered your dashboards to display July data, then that message is counted in the numbers.
| Message engagement |
The Message engagement dashboard provides the following metrics:
The Unique message engagement graph provides the following metrics:
You can also click Show data table to view these metrics in a table format. | ||||||||||||||||||||||||||||||
| Message engagement trends |
The Message engagement trends provides a graph to learn how recipients have engaged with your Bazaarvoice messages over time. This includes the number of messages where an engagement event was captured for the first time each hour during a specified time frame. Note that all time frames are based on Coordinated Universal Time (UTC). You can select one of the following time frames:
You can also select which metrics you want to view on the graph:
Once you’ve selected your time frame and metrics, you can hover over each line on the graph to view the specific numbers for each hour, day, week, or month. Select Show data table to view all metrics in a table format, broken down by time frame. |
Dashboards on the Total view
The Total view counts the total number of times that messages captured an engagement event at least once each hour in the selected period. By counting events each hour, we can better gauge how many users are returning to their message at a later time. This allows us to filter out the noise of extra clicks, page reloads, and message opens that occur within a few minutes of each other, which we consider to be part of the same interaction or engagement event.
For example, if a message was sent in June but opened in July, and you filtered your dashboards to display July data, then that message is counted in the numbers.
| Message engagement |
The Message engagement dashboard provides the following metrics:
The Total message engagement graph provides the following metrics:
You can also click Show data table to view these metrics in a table format. |
||||||||||||||||||||||||||||||
| Message engagement trends |
The Message engagement trends provides a graph to learn how recipients have engaged with your Bazaarvoice messages over time. This includes the number of messages where an engagement event was captured for the first time each hour during a specified time frame. Note that all time frames are based on Coordinated Universal Time (UTC). You can select one of the following time frames:
You can also select which metrics you want to view on the graph:
Once you’ve selected your time frame and metrics, you can hover over each line on the graph to view the specific numbers for each hour, day, week, or month. Select Show data table to view all metrics in a table format, broken down by time frame. |